
Introduction and Objective
This project delves into the application of machine learning for the classification of wine varieties. The primary objective was to develop and critically analyze various models capable of distinguishing between different types of wine based on their intrinsic chemical properties. The core goal was to explore the complete machine learning workflow, from data preparation to model deployment and evaluation, thereby creating a robust classifier while drawing insights from the dataset.
Methodology
The project was methodologically structured to follow a comprehensive machine learning pipeline, encompassing both supervised and unsupervised learning paradigms. The key stages of the project included:
Data Exploration and Preprocessing: Initial analysis of the wine dataset to understand its statistical properties, identify missing values, and handle outliers. Data cleaning and normalization techniques were applied to prepare the data for modeling.
Feature Engineering and Selection: Investigation of the chemical attributes to determine their relevance in wine classification. Feature selection methods were employed to identify the most impactful features, reducing model complexity and improving performance.
Model Implementation:
Supervised Learning: Training of various classification algorithms, such as Logistic Regression, Support Vector Machines (SVM), Decision Trees, and Random Forests, to predict the wine category.
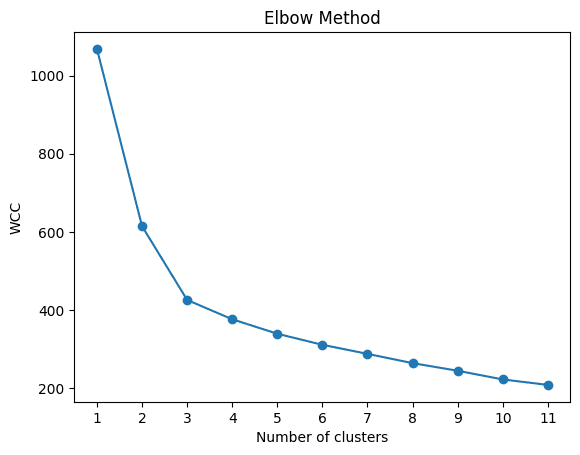
Unsupervised Learning: Application of clustering techniques, like K-Means, to identify natural groupings within the data, providing an alternative perspective on the wine sample classifications without prior labeling.
Model Evaluation and Comparison: Systematic assessment of the trained models using a variety of performance metrics, including accuracy, precision, recall, F1-score, and the confusion matrix. The results were cross-validated to ensure the reliability and generalizability of the models.
Tools and Technologies
The successful execution of this project was made possible through the proficient use of the following tools and technologies:
Programming Language: Python
Libraries:
Pandas & NumPy: For data manipulation and numerical operations.
Matplotlib & Seaborn: For data visualization and exploratory data analysis.
Scikit-learn: For implementing machine learning models, preprocessing, and evaluation metrics.
Results and Analysis
The project yielded significant insights into the efficacy of different machine learning models for wine classification. Key findings include:
A comparative analysis demonstrated the superior performance of ensemble methods, such as Random Forest, in accurately classifying the wines.
Feature selection proved to be a critical step, enhancing model accuracy and interpretability by focusing on key chemical differentiators.
The evaluation metrics provided a multifaceted view of each model's performance, highlighting the strengths and weaknesses of each approach in distinguishing between the wine classes. The unsupervised clustering results were also compared against the actual labels, revealing the inherent separability of the data.
Conclusion
This project successfully demonstrated the feasibility and effectiveness of using machine learning techniques to classify wines based on their chemical attributes. Through a structured approach of data preprocessing, feature selection, and model evaluation, a high-performing classification system was developed. The comprehensive analysis of various models not only achieved the primary objective of accurate classification but also provided a deeper understanding of the practical application and comparative performance of different supervised and unsupervised learning algorithms.