Introduction and Objective
This project, developed during a data analysis and visualization course, aimed to analyze a continuously updated dataset of the most streamed songs on Spotify in 2023. The main objective was to identify trends and patterns in popular music, exploring the relationships between various musical attributes and their impact on a song's success, measured by stream counts and playlist inclusions.
Methodology
The project followed a structured data analysis methodology, encompassing the following steps:
Data Loading and Initial Exploration: The dataset,
spotify-2023.csv, was loaded using pandas. An initial exploration was conducted to understand its structure, features, and data types.Data Cleaning and Preprocessing: This was a crucial phase to ensure data quality. Key actions included:
Handling missing values in the 'key' and 'in_shazam_charts' columns by replacing them with 'Unknown' and 0, respectively.
Correcting data types for columns like 'streams' and 'in_deezer_playlists' to ensure they were numerical for accurate analysis.
Identifying and removing duplicate track names to avoid skewed results.
Exploratory Data Analysis (EDA): Various analyses were performed to extract insights:
Descriptive Analysis: A statistical summary of the numerical features was generated to understand their distribution.
Qualitative and Quantitative Analysis: Specific musical characteristics were investigated, such as:
The top 10 most "danceable" songs.
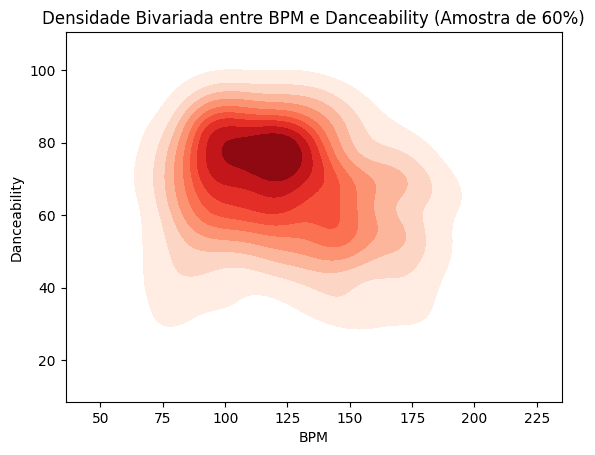
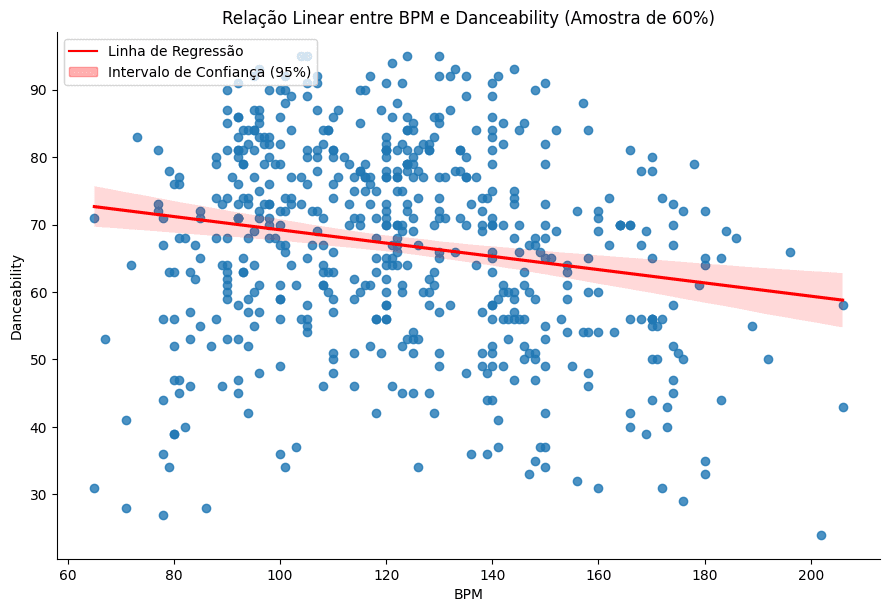
The correlation between a song's BPM (Beats Per Minute) and its danceability.
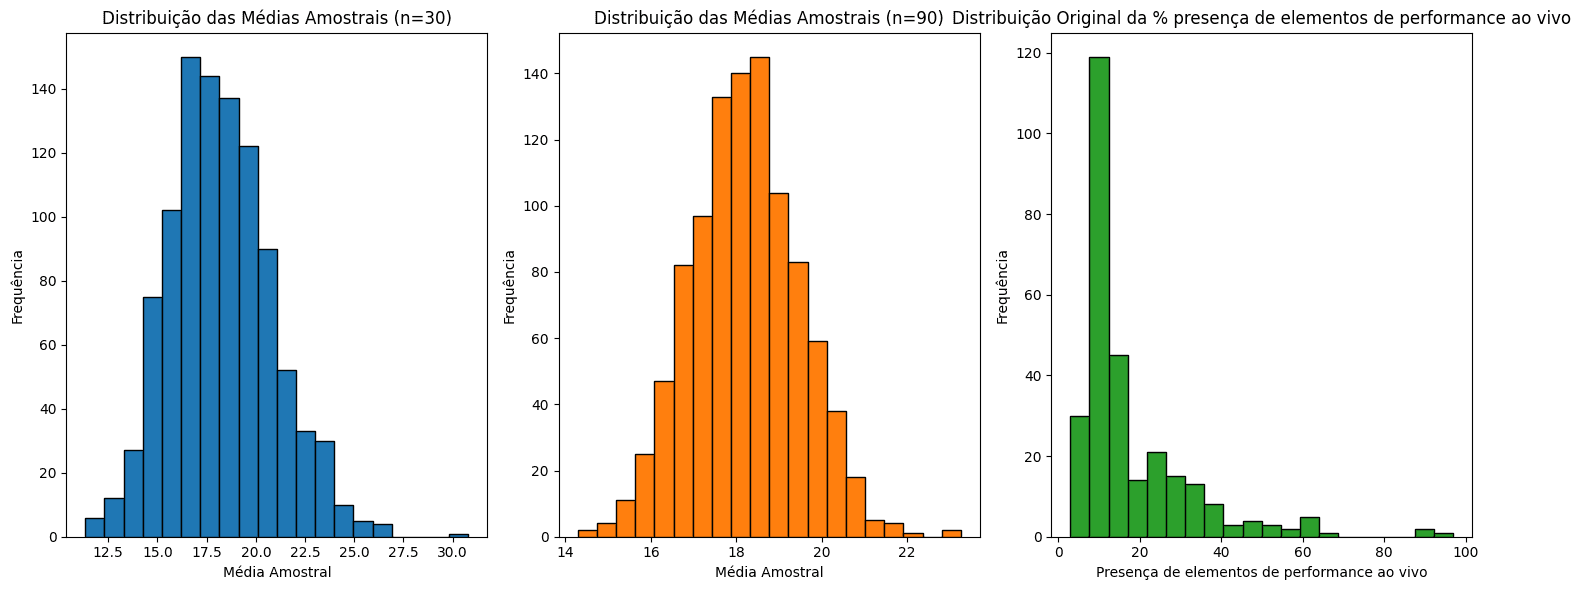
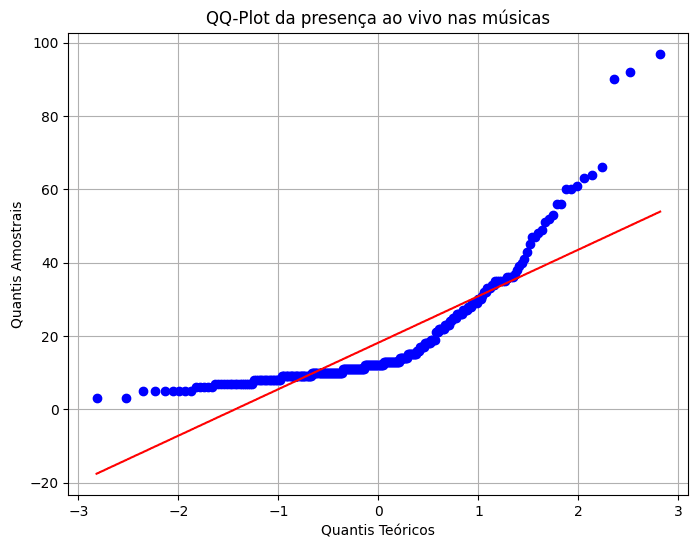
The songs with the highest percentage of instrumentalness and liveness.
The evolution of these musical elements in popular songs since the year 2000.
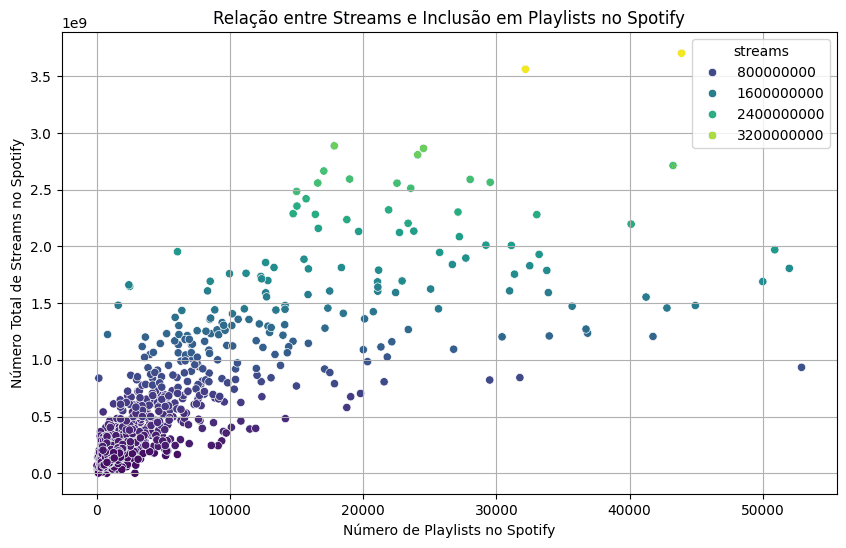
Relationship Analysis: The connection between the number of streams and a song's inclusion in Spotify playlists was analyzed to understand the impact of playlists on song popularity.
Tools and Technologies
The project was developed in a Python environment, leveraging the following libraries for data manipulation, analysis, and visualization:
Pandas & NumPy: For data manipulation and numerical operations.
Matplotlib & Seaborn: For creating static data visualizations.
Plotly Express & Plotly Graph Objects: For creating interactive charts and graphs.
SciPy: For statistical analysis and hypothesis testing.
Results and Analyses
The analysis revealed several key insights into the characteristics of the most streamed songs of 2023:
Danceability: Songs with high danceability percentages, such as "Peru" and "The Real Slim Shady", were prominent in the dataset. However, a weak negative correlation was found between BPM and danceability, suggesting that a faster tempo does not necessarily mean a song is more danceable.
Instrumentalness and Liveness: The analysis identified the top 10 songs with the most instrumental and live elements, highlighting a niche for such tracks within the popular music landscape. A trend analysis since 2000 showed fluctuations in the prevalence of these elements over time.
Streams and Playlist Inclusion: A strong positive correlation was observed between the number of times a song is included in Spotify playlists and its total number of streams, confirming the significant role of playlists in driving a song's popularity.
Conclusion
This project successfully identified key characteristics and trends within the most streamed songs of 2023. The findings demonstrate the importance of musical attributes like danceability and the significant impact of playlist inclusion on a song's streaming success. The project showcases skills in data cleaning, exploratory data analysis, statistical analysis, and data visualization using various Python libraries.