Project Summary
This project consists of a comprehensive and interactive dashboard, developed in Microsoft Power BI, to analyze a vast dataset of thousands of LEGO sets. The main objective is to extract strategic insights about the product portfolio, market trends, theme performance, and pricing behavior, offering a powerful tool for decision-making.
Objectives
Analyze Sales Performance: Identify the most successful themes, categories, and products in terms of volume and potential revenue.
Understand Temporal Trends: Visualize the evolution of the number of releases, complexity (piece count), and average set price over the years.
Segment the Portfolio: Analyze the distribution of products by age range, themes, and categories to understand LEGO's market focus.
Provide an Interactive Tool: Create an intuitive interface that allows for dynamic data exploration through interactive filters and selections.
Tools and Technologies
Platform: Microsoft Power BI
Analysis Language: DAX (Data Analysis Expressions) for creating custom metrics and KPIs.
Data Source: Analysis based on a consolidated dataset of LEGO products, including information on sets, themes, pieces, prices, and year of release.
Key Features and Analyses
The dashboard is organized into three main panels, each with a specific analytical focus:
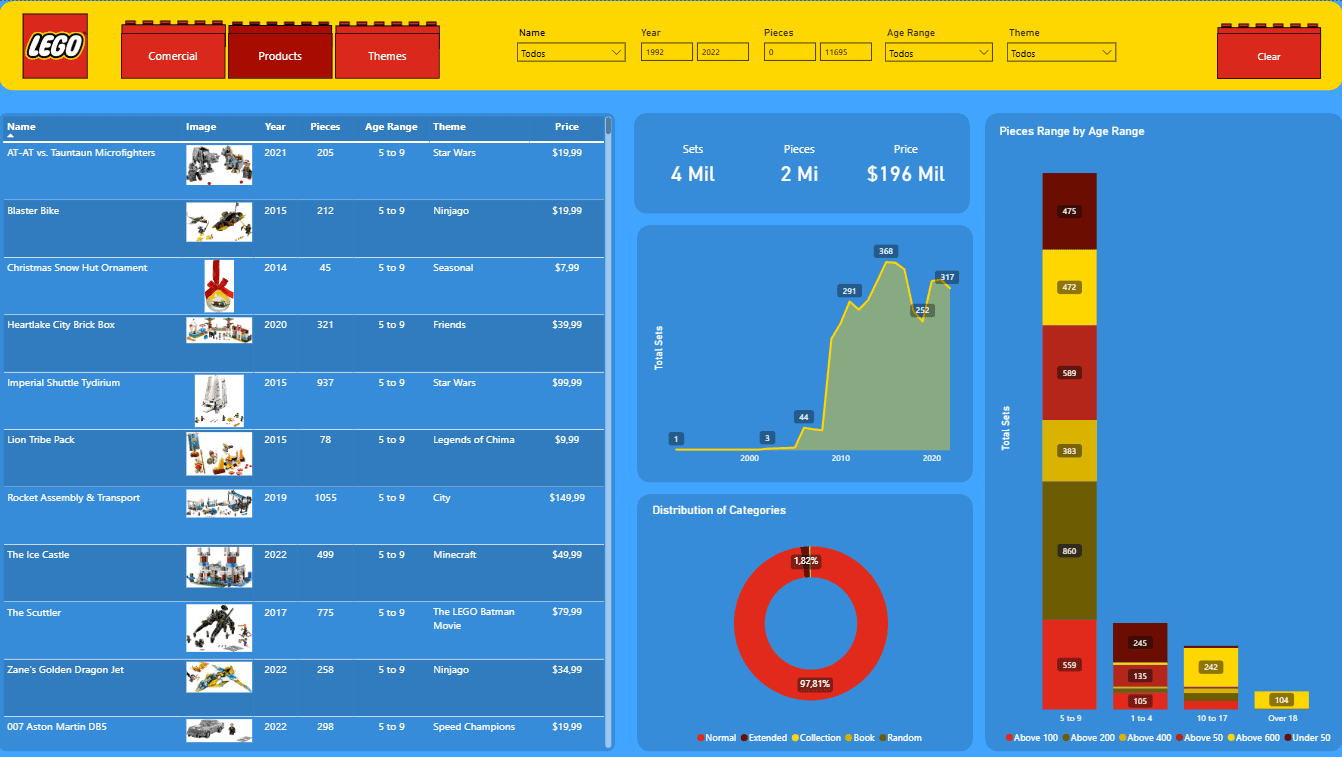
1. Products Panel (General Overview):
Strategic KPIs: Presents the total numbers of sets, pieces, and the consolidated value of the portfolio.
Temporal Analysis of Releases: An area chart demonstrates the significant growth in the number of sets released, with a notable peak in recent years.
Distribution by Age Range: A stacked bar chart reveals that the 5 to 9 years age range is the primary target audience, concentrating the largest quantity of products.
Detailed and Interactive Table: Allows for a detailed view of each set, including its image, theme, price, and piece count, with dynamic filters for year, theme, and more.
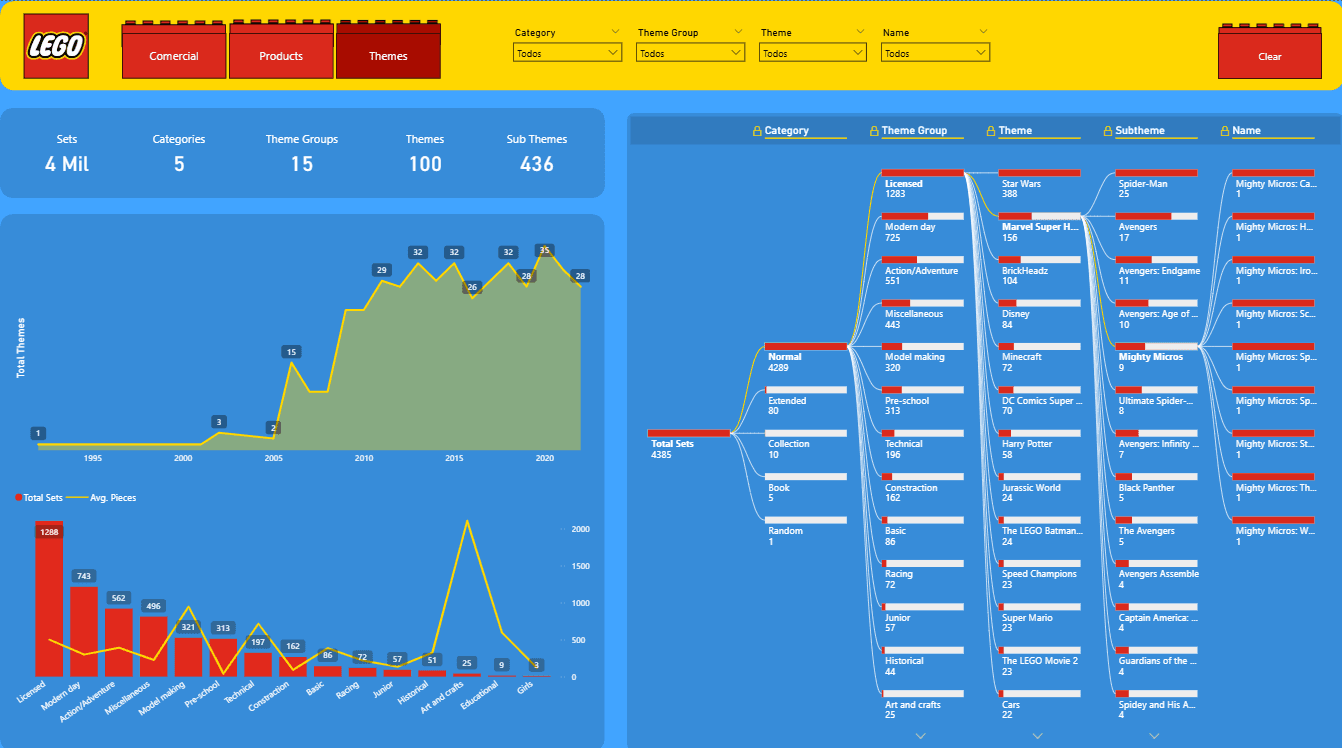
2. Themes Panel (Hierarchical Analysis):
Product Hierarchy: Clear KPIs show the portfolio structure, broken down into Categories, Theme Groups, Themes, and Sub-themes.
Decomposition Tree: A powerful visual that allows the user to navigate hierarchically from the broadest category (e.g., "Licensed") down to the specific product (e.g., "Mighty Micros: Spider-Man vs. Scorpion"), easily identifying areas with the highest concentration of products, such as Star Wars.
Theme Performance: A comparative analysis between the volume of sets and the average piece count per theme group, highlighting the leadership of "Licensed" in quantity and the complexity peaks in themes like "Art and crafts."
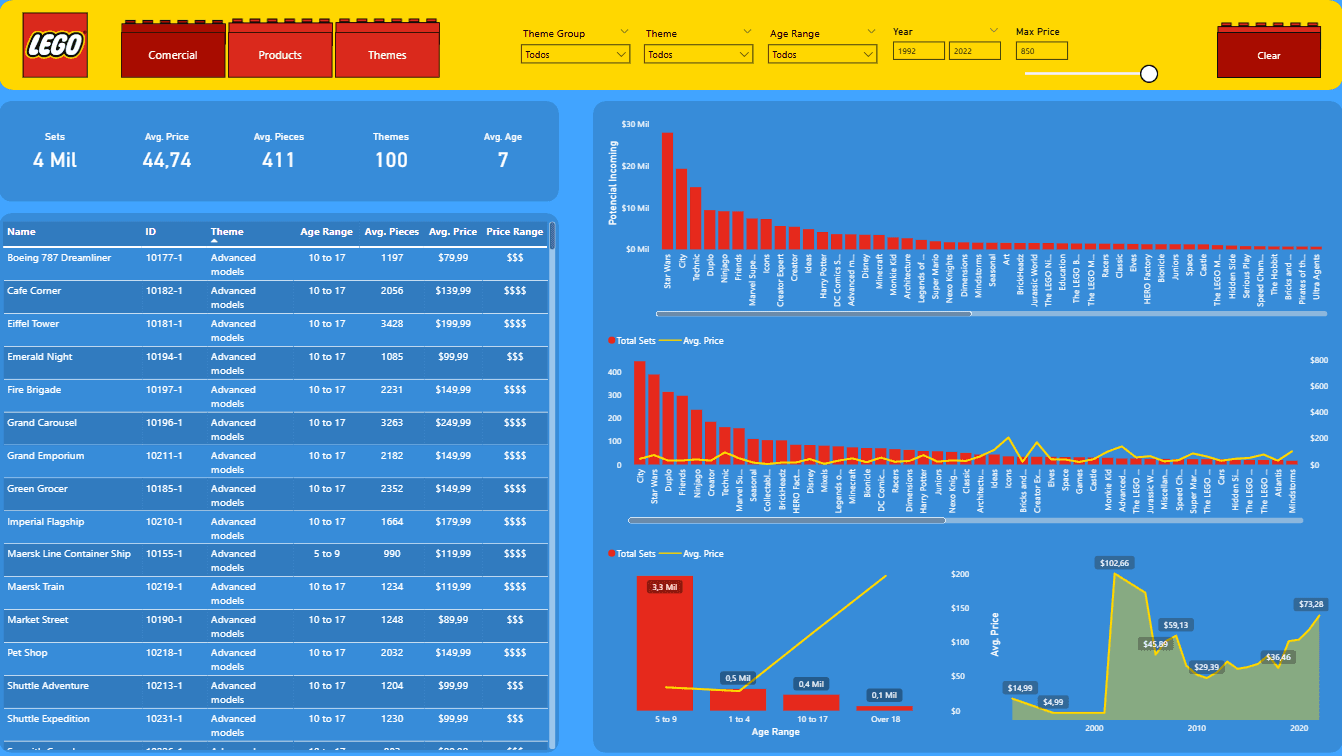
3. Commercial Panel (Profitability Analysis):
Revenue Potential: A bar chart identifies the potential revenue by theme, highlighting "Star Wars" as the absolute leader, followed by "Creator Expert" and "Friends."
Price Analysis: An area chart shows a clear upward trend in the average price of products over time, indicating a possible value-add strategy or the launch of more complex and expensive sets.
Advanced Filters: The inclusion of a maximum price slider and age range filters allows for niche analysis, focusing on high-value products or specific consumer segments.
Dashboards