Project Summary
This project is a complete dashboard for personal finance control and analysis, developed in Microsoft Power BI. The solution centralizes transactions from multiple bank accounts into a single interface, providing the user with a holistic view of their financial health, with analyses of cash flow, net worth evolution, expenses by category, and goal tracking.
Objectives
Centralize Information: Consolidate data from different sources (banks) for a unified financial analysis.
Monitor Cash Flow: Track inflows (credits) and outflows (debits) in detail to understand monthly movements.
Analyze Spending Patterns: Identify the main expense categories, assisting in budget creation and spending optimization.
Track Goals and Investments: Visualize progress toward financial goals (like a target balance) and monitor investment performance.
Tools and Technologies
Platform: Microsoft Power BI
Analysis Language: DAX (Data Analysis Expressions) for calculating financial KPIs, such as cumulative balance, totals by category, and performance metrics.
Data Source: Analysis based on bank statements and financial transaction spreadsheets, which were processed and modeled for the analysis.
Key Features and Analyses
The dashboard was designed to offer a 360º view of the user's finances through several analytical components:
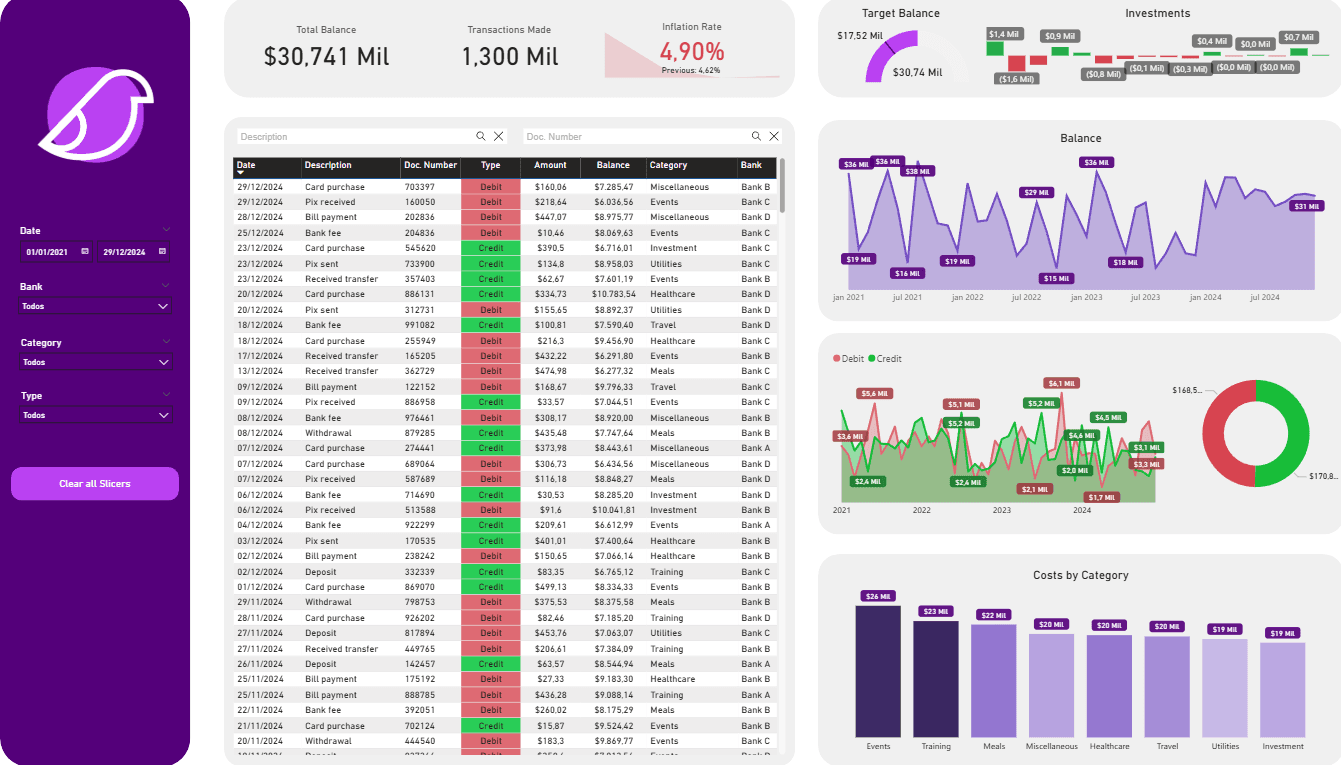
Control Panel (Main KPIs): The top of the dashboard displays the most important indicators clearly and immediately:
Total Balance: The consolidated net worth.
Transactions Made: The total volume of movements in the period.
Inflation Rate: A macroeconomic data point to contextualize purchasing power.
Target Balance: A goal-tracking KPI that compares the current balance against a predefined target.
Investments: Cards that summarize the values allocated in different types of investments.
Cash Flow Analysis (Debit vs. Credit): An overlapping area chart allows for a direct visual comparison between revenue and expenses over time, making it easy to identify months with a surplus or deficit.
Net Worth Evolution: The "Balance" area chart shows the trajectory of the total balance month by month, allowing for a clear visualization of net worth growth (or decline).
Expense Analysis by Category: A bar chart details where the money is going, classifying costs into categories like "Events," "Housing," "Healthcare," and "Travel," which is essential for any budget planning.
Detailed Transaction Log: An interactive table displays all transactions, allowing for searches, filters, and the verification of specific entries, ensuring full transparency and control.
Dashboard